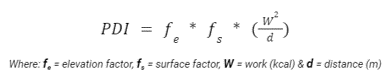
Introducing the PJAMM Difficulty Index (PDI)
-At PJAMM, we have long depended on the FIETS index to assess the difficulty of climbs. While it has served us well, we recognize that the FIETS index is not without its limitations. Thus, we are driven by a desire to refine and enhance the existing methodology, leading us to develop our own comprehensive difficulty index. Below, you'll find the general formula, and we'll guide you through each component.
Our goal was to keep the index simple, only requiring users to input key characteristics of their route, as it stands currently with FIETS. However, we aimed to introduce additional route parameters to more accurately capture the route profile while tackling two critical issues with the FIETS index. Firstly, FIETS overlooks the total elevation gained in a climb, only considering the difference in elevation. For instance, if a climb starts at sea level and ascends to 5,000 feet but involves descents along the way, resulting in a total elevation gain of 8,000 feet, FIETS would only credit the rider for 5,000 feet. Secondly, FIETS fails to acknowledge riders' efforts on flat surfaces. Thus, both a 10 mile and a 100 mile flat ride would receive a FIETS score of 0.
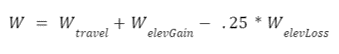
To tackle the shortcomings of the FIETS index, we've chosen to replace the ride height in the FIETS equation with the total work completed by the rider. This encompasses the work required to traverse flat terrain, accounting for wind resistance and road friction, as well as the effort needed to ascend in elevation, overcoming gravity. We also required a method to impose a penalty for descents, as they offer a period of recovery, and the kinetic energy gained from downhill segments assists in the subsequent transition to climbing once more. The total work is computed by summing the work required to travel a flat distance with the work needed to ascend in elevation and subtracting a percentage of the work done by gravity during descents.
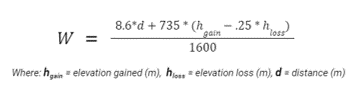
In order to calculate work, we must establish the following parameters. The first is the combined weight of the rider and their bike, which we've set at 75 kg. The second parameter is the rider's average speed, set at 5 m/s. The third parameter needed is the power required for a 75 kg cyclist traveling along a flat road at 5 m/s, we've determined this to be 43 watts. While these parameters will naturally differ for each rider and riding conditions, employing a set of fixed values is essential for enabling comparisons between routes. Incorporating our predetermined parameters and converting to kilocalories (to achieve a more suitable scale for the resulting index), our equation for calculating work becomes:
We've also modified the method by which elevation bonuses are awarded. FIETS grants a bonus determined by the maximum elevation attained, solely for elevations surpassing 1,000 meters (3,280.8 ft). Moreover, FIETS assigns an identical bonus regardless of the ride's length or difficulty. Consequently, a 1 mile ride at 10,000 feet receives the same bonus as a 100 mile ride at the same elevation. Additionally, the bonus maintains a linear relationship as the max elevation increases. We aimed to grant this bonus in the form of a multiplier termed the elevation factor (fe). This multiplier would consider the minimum elevation to provide a more accurate assessment of the ride's elevation profile. A ride that starts from 5,000 ft and ascends to 10,000 ft should get a larger multiplier than one that starts from sea level and goes to the same 10,000 ft. The calculation for the elevation factor is as follows:
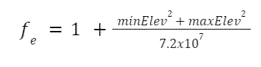
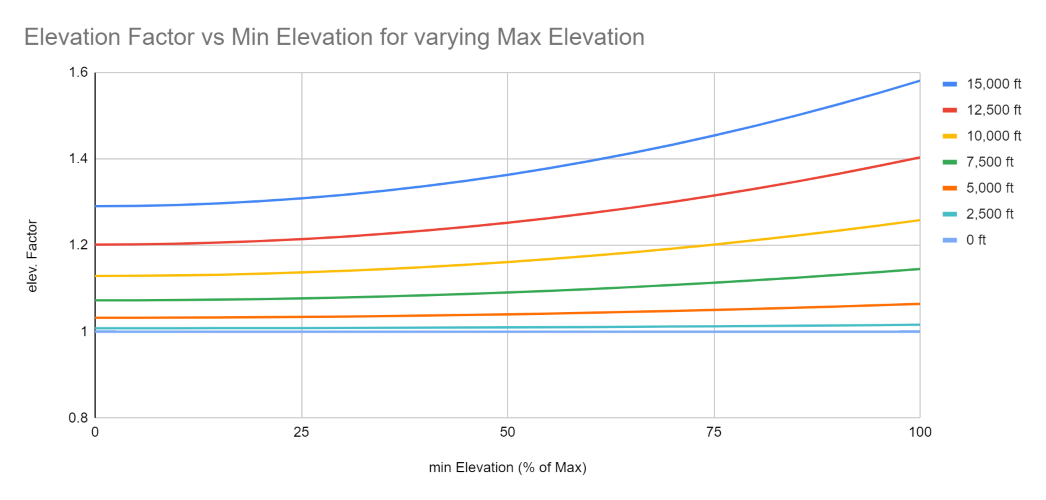
The following graph illustrates the behavior of the elevation factor for different maximum and minimum elevations. Each plotted line represents a distinct maximum elevation, with the minimum elevation depicted on the x-axis as a percentage of the maximum elevation. For example, the dark blue line maintains a constant maximum elevation of 15,000 ft, while the minimum elevation ranges from 0 ft to 15,000 ft.
Lastly, we aimed to integrate the capability to account for surface conditions. We are introducing our surface index, which ranks surface conditions from 0 (paved road) to 5 (treacherous terrain). Any surface index above 0.5 will denote a gravel ride. Subsequently, the surface index is converted into a surface factor (fs), which serves as a multiplier for our difficulty index. The equation for this is as follows:
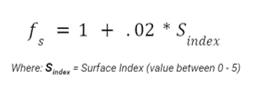
Below are the various levels for the surface index. A ride's surface index may fall between these levels; it does not necessarily have to be a whole number.
0 = Paved road
1 = Maintained unpaved road
2 = Semi-maintained dirt road
3 = Unmaintained dirt road
4 = Rutted and/or rocky backcountry trail
5 = Rutted and/or rocky trail suitable for 4x4 single-track vehicles, requiring expert skills
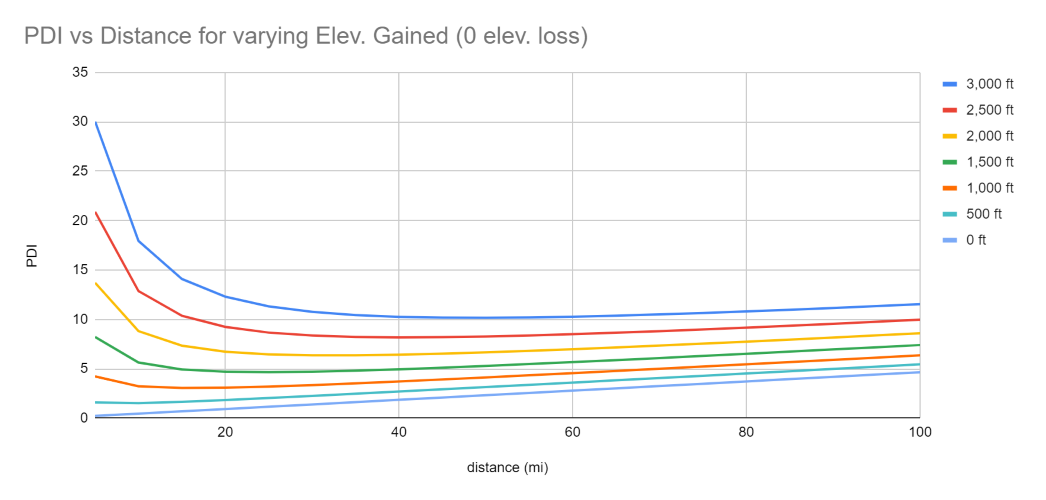
Now that we have our complete equation, we can examine how the difficulty index behaves at different values for elevation gained and distance. Each plotted line represents a fixed elevation gained value, and the PDI is calculated for distances ranging from 5 mi to 100 mi. Here, we observe that if we keep elevation gained constant, the PDI decreases as the ride distance increases for shorter distances but begins to rise again.
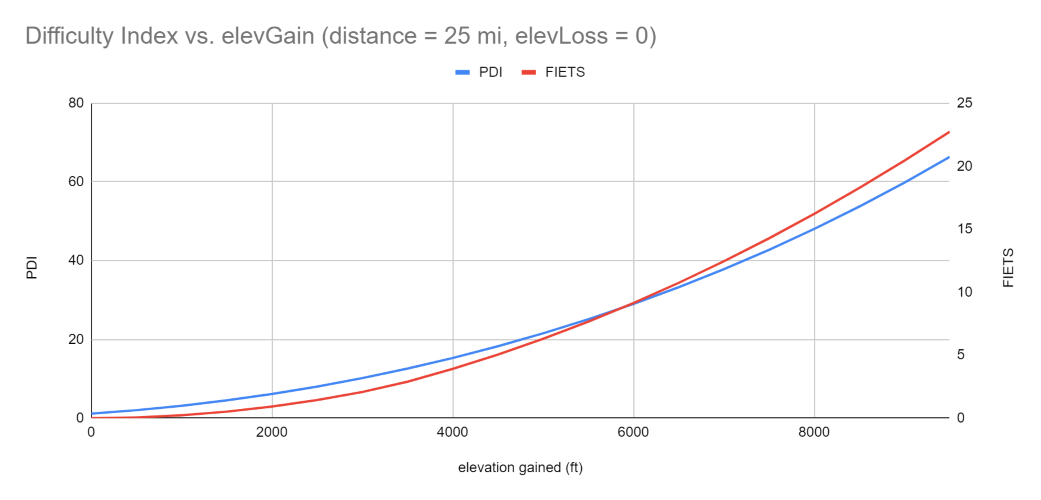
The next three graphs illustrate the comparison between the PJAMM Difficulty Index and FIETS. In the first two graphs, we maintain elevation loss at 0 to facilitate a direct comparison using similar parameters.
In the first graph, we keep the distance constant and incrementally increase elevation gained from 0 to 10,000 feet. Here, we observe that both FIETS and PDI exhibit similar behavior.
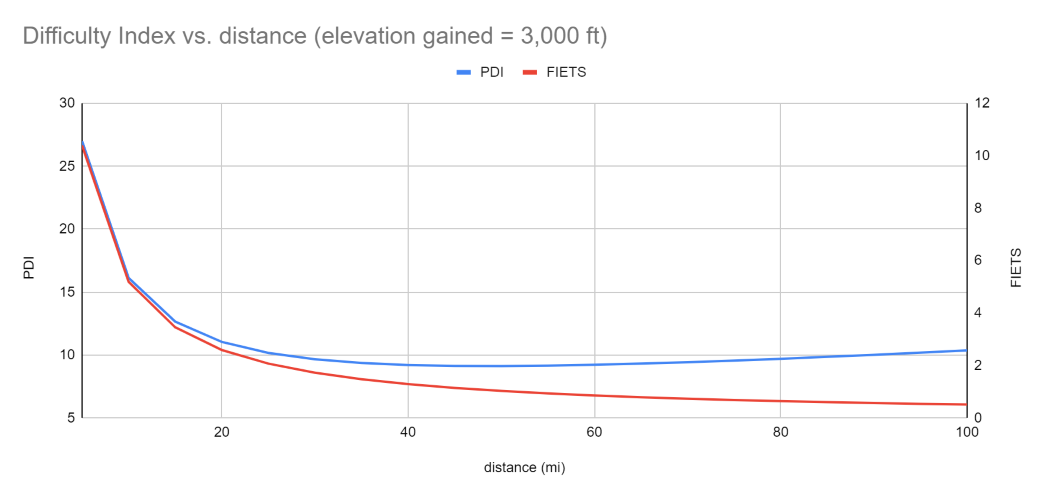
In the next graph, we hold elevation gained constant while increasing the distance. Since FIETS solely utilizes ride height in its numerator, the index steadily declines towards 0 as distance increases. Conversely, since we incorporate work into our numerator, we notice that the PDI initially decreases with distance, but eventually starts to plateau and even rise again.
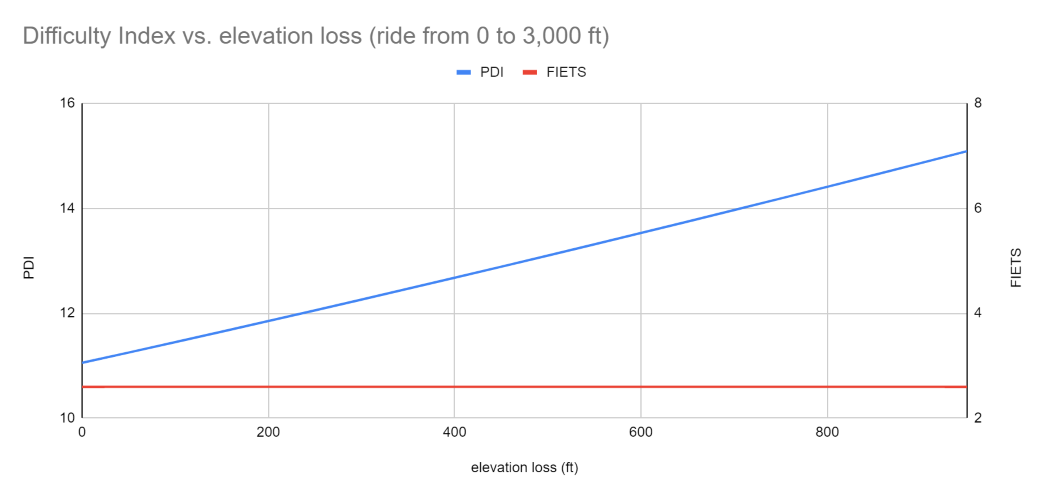
This final graph highlights the most significant difference between FIETS and PDI. In this simulation, we depict a ride that starts from sea level and finishes at 3,000 feet. We then examine how each index behaves as we vary the amount of elevation loss during the ride. For instance, if a ride starts at sea level and experiences 1000 feet of elevation loss before reaching 3,000 feet, the total elevation gained would be 4,000 feet. Since FIETS solely considers the ride height (3,000 feet), a ride that climbs to 3,000 feet with no elevation loss receives the same index value as a ride with 1,000 feet of elevation loss.